Spreadsheets, Graphs and Scientific Data Analysis
Complete at least one activity in each section, and at least 75% of all individual activities.
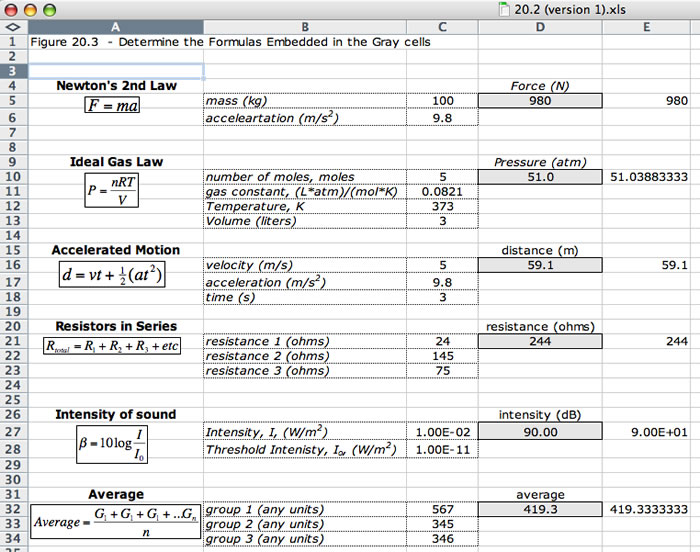
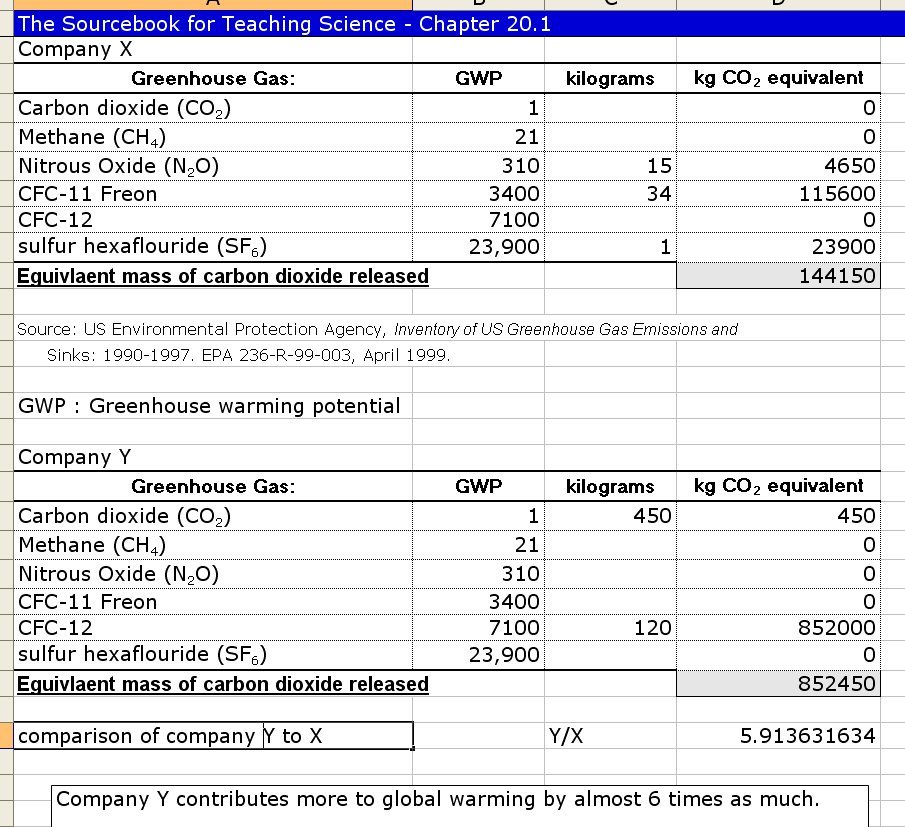
(1) Calculations and computer modeling (20.1)
(2) Relating graphs with real-world experiences (20.2)
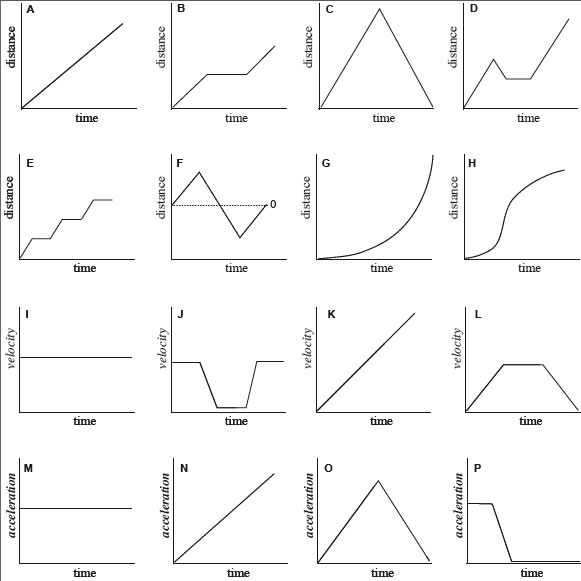
In class we walked these graphs. For example, for graph F, a person would walk at a constant speed forward about 5 steps, then backward at constant speed for 10 steps, and then forward for 5 steps again at constant speed.
(3) Graphing stories (20.3)
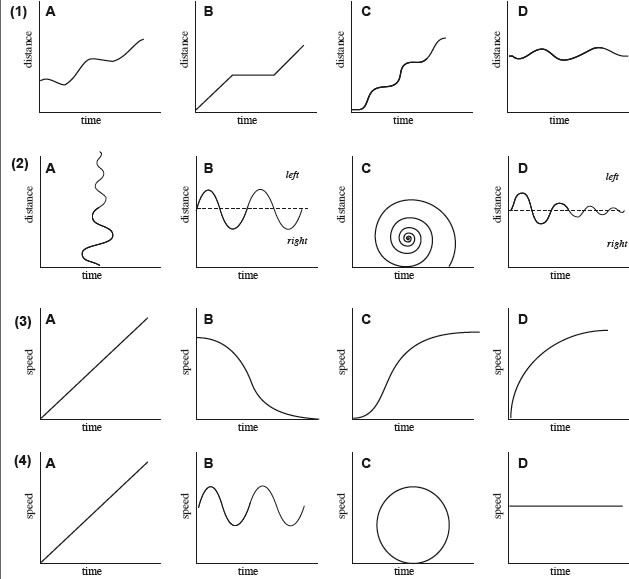
- commuter bus – 1C
- swinging pendulum slowing – 2D
- accelerate onto a freeway – 3C
- rocket engine continuous – 4A
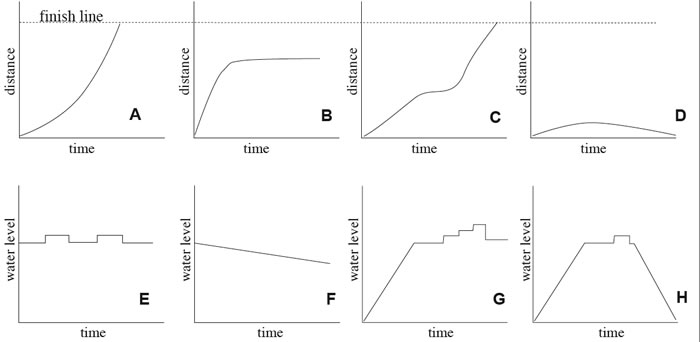
- starting the race at a slow pace and the running faster as your body warms up and your muscles stretch
- running the first section, getting tired and then taking a nap under a tree
- running the first half of the race, then needing a bathroom break, then trying to catch up to your running buddy by increasing your pace slightly
- starting the race then realizing you hate running and walking back to your car
- a child jumps in the pool and then out, in and then out again
- the pool has developed a leak and is slowly losing water
- the pool is refilled from empty, then three kids jump in one at a time, then they all jump out together
- the pool is filled from empty, a child jumps in, pokes a hole in the bottom and the entire pool drains
(4) Scatter and line graphs (20.4)
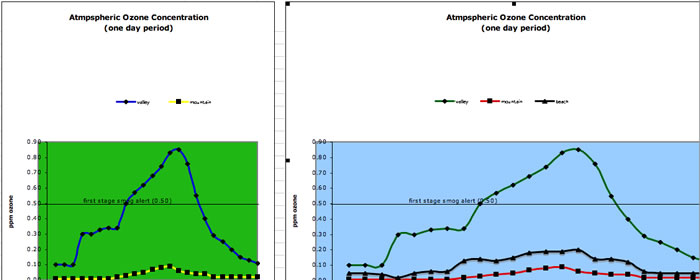
As seen in the graph on the right, the valley has the greatest concentration of ozone during a given day
(5) Column and bar graphs (20.5)
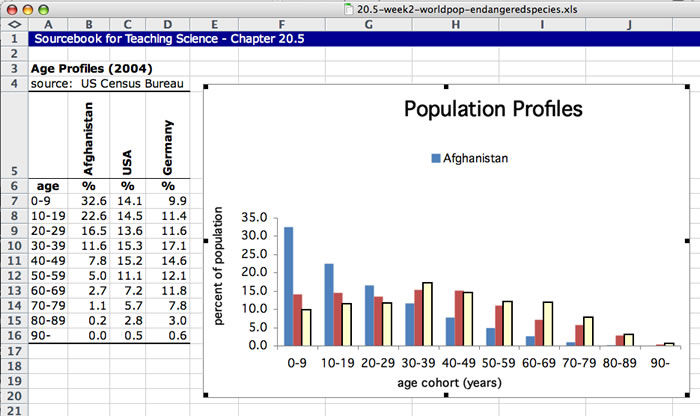
Germany (white) is more similar to the United States (red) than to Afghanistan (blue).
(6) Pie and area graphs(20.6)
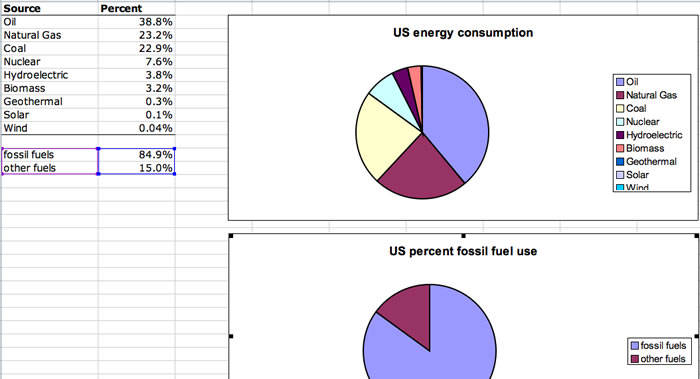
Although the picture is cut-off, the U.S. uses about 85% fossil fuel. We need an alternative now.
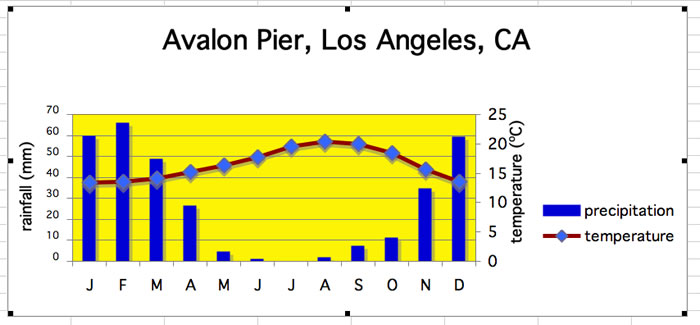
(7) High-low / combination / log plots (20.7)
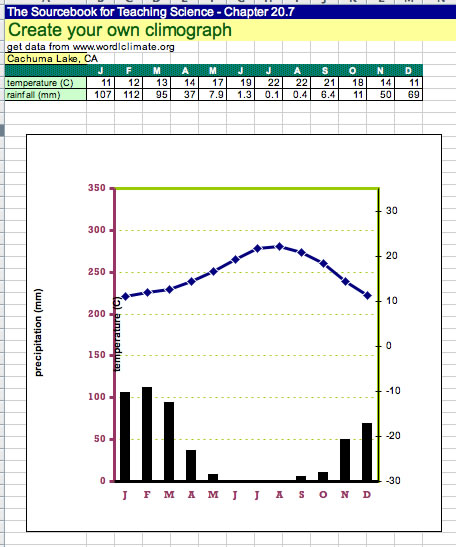
This is the climate graph for Cachuma Lake, CA, which is located behind Santa Barbara. Summers are very warm and dry and the area around the lake is a Chaparral biome.
(8) Statistics (20.8)
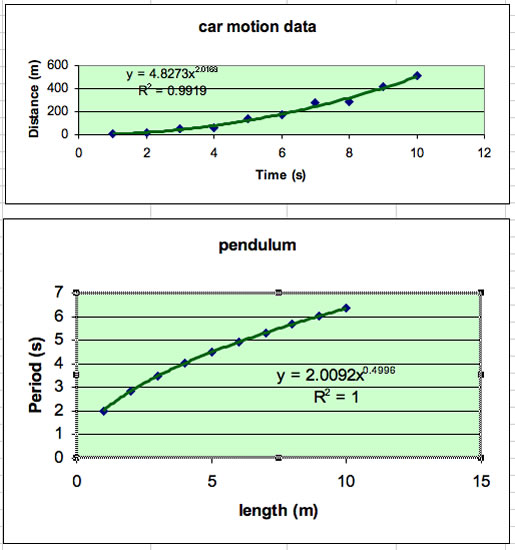
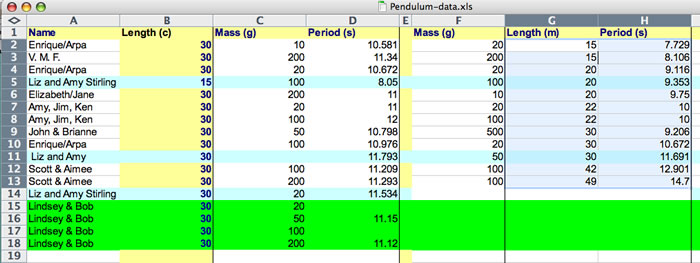
inclass .xls file (pendulum)