(1) Data Analysis with Spreadsheets
(1) Inquiry Activity - Analyzing data with spreadsheets - Density & Buoyancy
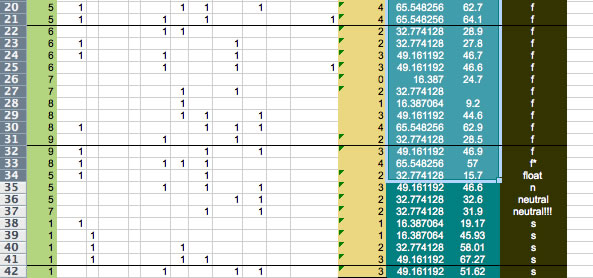
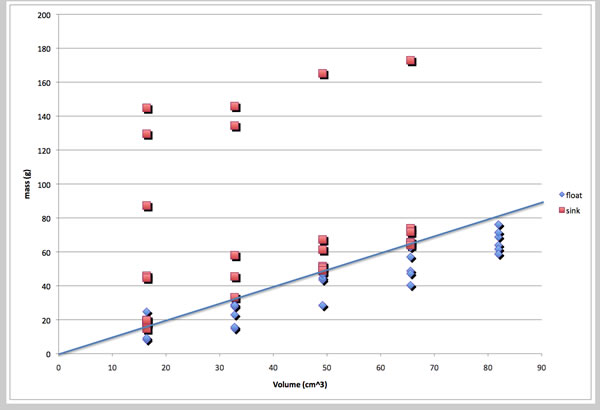
Place a can of diet soda and a can of regular soda in a container of water and note that the diet soda floats while the regular soda sinks. Why? Try to answer this question in the following inquiry investigation. Obtain a set of “density blocks” from a scientific supply company [sciencesourcebook.com, carolina.com or search density blocks]. All of the blocks are the same size and thus have the same volume, but some sink and some float in water. Determine the volume of the blocks by cubing the length of a side. Express the volume in cubic centimeters. Many supply companies provide blocks with a volume of one cubic inch (1 cubic inch = 16.4 cubic centimeters). Test all blocks in a container of water and record those that float and those that sink. What makes some blocks float, and others sink? What will happen if you combine blocks? Connect blocks with rubber bands and record whether they sink or float (figure 22.2). Record the mass of each combination, the number of blocks, and note whether it sinks or floats. Plot the mass of each combination on the y-axis, and the volume on the x-axis. Indicate “floaters” with an open circle, and “sinkers” with a closed circle. Try to get combinations that neither float nor sink, but stay suspended in the middle of the water column. Examine the evidence you have collected and answer the question, “what determines if an object will sink or float?”
analysis - the best fit line yields the density of the fluid (water) in this case (1g/cm^2).
An inquiry lesson allows the student to draw their own conclusions by asking directed questions and actively engaging in finding answers to their questions. To be successful, the activity must have some natural boundaries or the students may not ask appropriate questions. Inquiry helps students to think like scientists, analyzed data, and make predictions.
(2) Analyzing experimental data - Reaction time
- Import, format, graph, and analyze class data on reaction time
- Your website should include:
- .xls file with class data
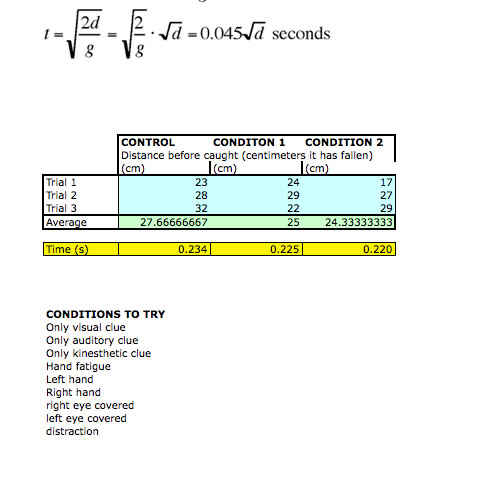
- The results varied quite a bit due to both the high quality of timing and of the person catching the ruler. What we can conclude is that it takes a significant amount of time for the brain to send a signal to the hand telling it what to do. I have also noticed this affect during labs. Students will often time things using a stopwatch and be off by about 0.2 seconds, similar to the delay time we found above.
(3) Analyzing experimental data - Mitosis
- Analyze experimental data on mitosis.
- .xls file with class data
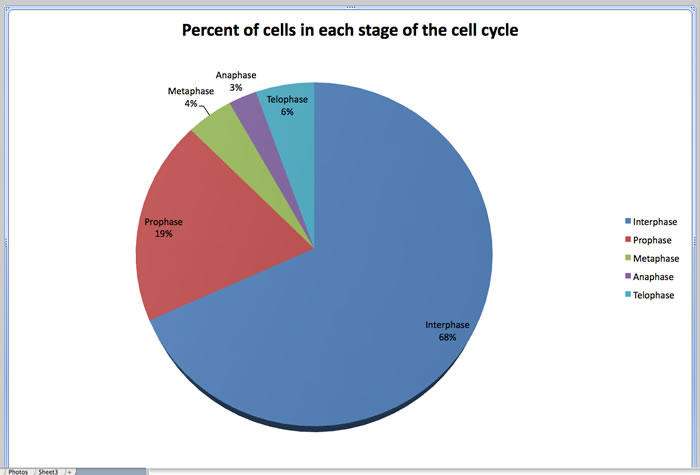
- Based on the graph, we can conclude that plant cells (onion root cells) spend the majority of their time in Interphase. We could expand the experiment to other types of cells, other types of plants, during different months, etc. to gain a clearer picture of mitosis.
(4) Analyzing experimental data - Genetics
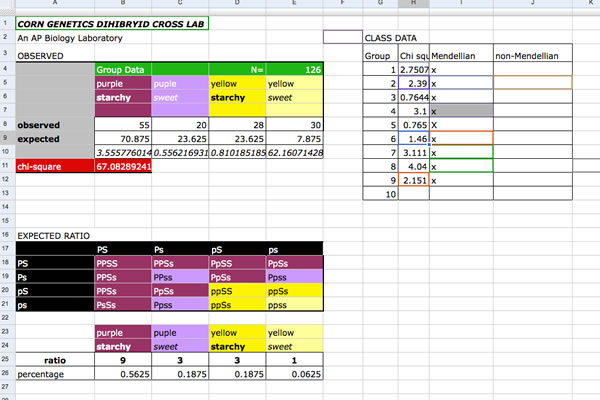
- Dihybrid Cross - AP Biology genetics lab (corn)
- the excel file is located in google docs and would not export
(5) Using spreadsheets to create scale models
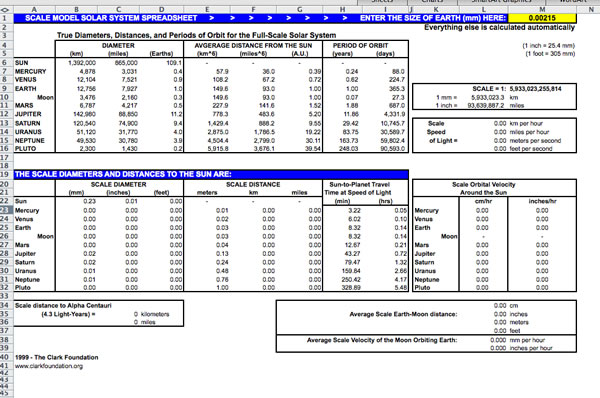
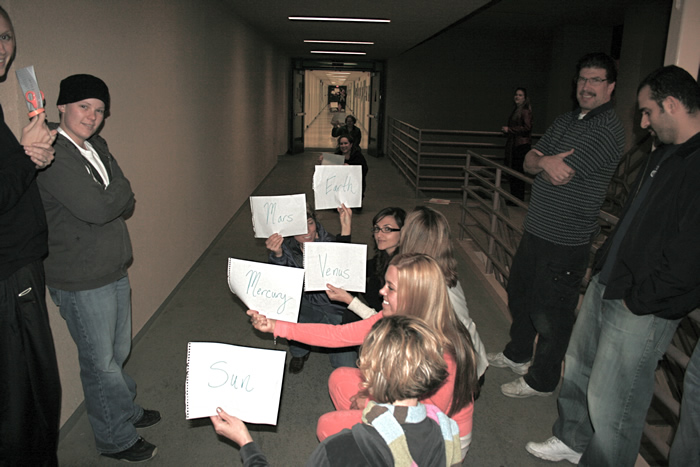
- Express the measurements of a scale model of the solar system designed to fill your classroom or the football field.
- Express the relative sizes or distances of the planets in graphic form
-

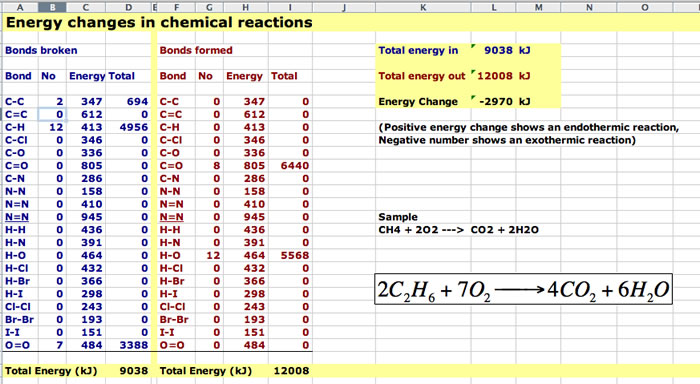
Determine the energy of reaction of the combustion of methane (CH4) and ethane (C2H6)
.xls file with data
You lose 2970 kJ during the reaction per 2 moles of ethane burned